How did rates change between two months?
In Rate Watch, Analysis shows how payer medians moved between two months of data, by category, with the biggest moves named.
1 video · 9 sec in all
Video 1 of 1 · 9 sec
Compare two months
Captions are in the video. The steps and the full narration are below.
Step by step
Before you start. Analysis needs two loaded months of data. It opens on the latest pair of months for your profile state.
- Click Rate Watch in the top bar, then click the Analysis tab.
- Open the Months menu. It starts on the latest pair, for example Sep → Oct 2026.
- Pick another pair, for example Aug → Sep 2026.
What you see. The Months menu now reads Aug → Sep 2026, and each row of the Box plot shows how one product category moved between those two months.
Tip. NAMED OUTLIERS on the right lists the largest increases and decreases, and Violin shows the same moves as a density.
Read the narration
In Rate Watch, click Analysis. Then open Months and pick another pair. Each row shows one category's moves.
Screens from this video
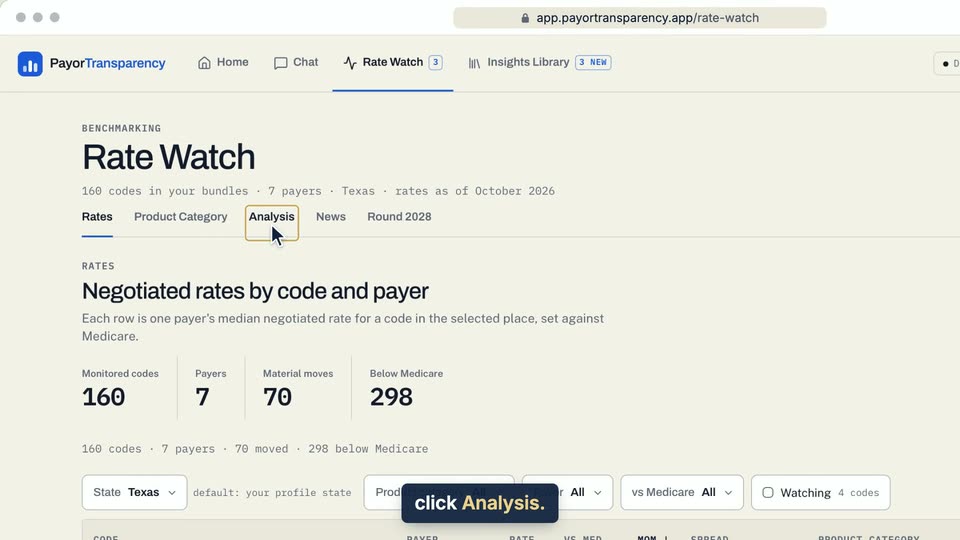
01 In Rate Watch, click Analysis. 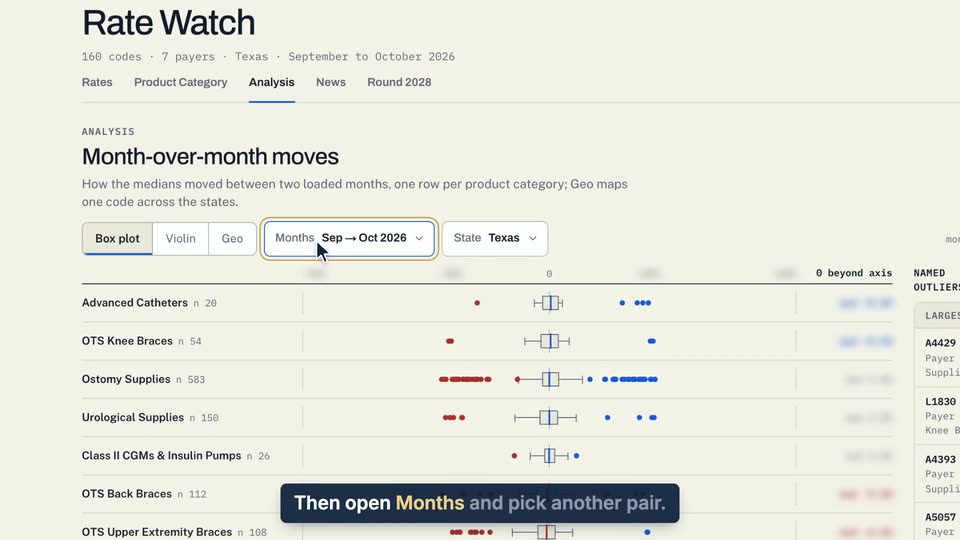
02 Then open Months and pick another pair. 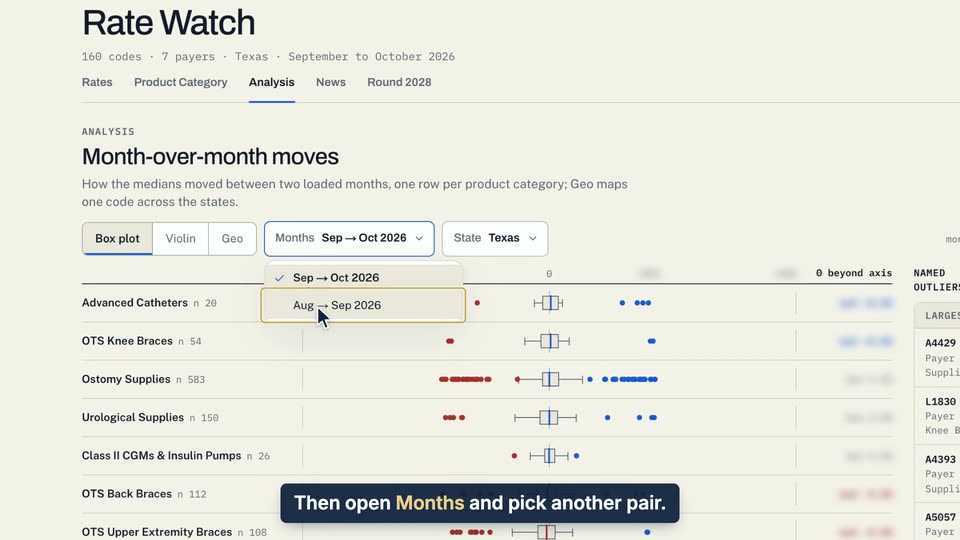
03 Then open Months and pick another pair.
- Use case
- How did rates change between two months?
- Feature
- Analysis Box plot and Violin
- Task
- Compare two months